
Navigating to Leaderboards
On the left-hand sidebar of Tully, go to Reports and click Leaderboards.
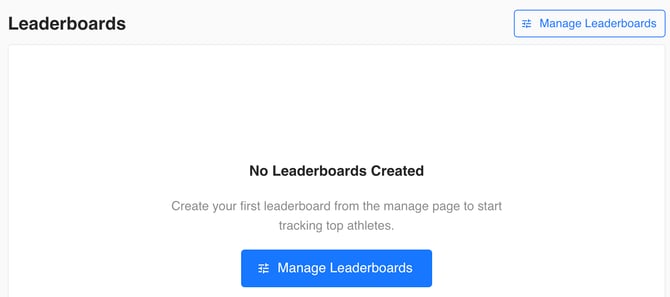
If no leaderboards have been created yet, the page will show No Leaderboards Created. From here, you can begin setting up your first leaderboard.

Managing Leaderboards
Select Manage Leaderboards to open the full management page. This area includes all available filters and the Leaderboards table.
Filters Available
-
Name, Teams, Groups, Gender, Active or Inactive status, Age Range, Data Collection Dates (a From and To time frame), Class Year
In the top right, you will also see:
-
Add Leaderboard button
-
Display button (used to view leaderboards once created)
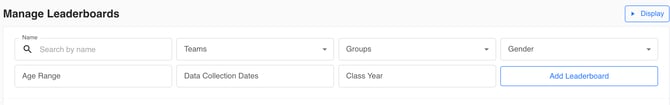
Table Columns
-
Name, Metric or Assessment, Teams, Groups, Gender, Age Range, Data Collection Year, Class Year

Creating a Leaderboard
-
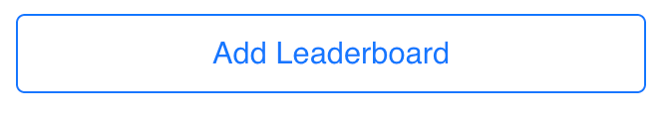
Click Add Leaderboard.
-
Fill out the required fields:
-
Name
-
Metric or Assessment (choose whether this leaderboard tracks a single metric or an assessment)
-
-
Add optional filters to define which data should appear on the leaderboard:
-
Teams: Select one or multiple teams
-
Groups: Select one or multiple groups
-
Gender: Male, female, or both
- Active/Inactive Status: Choose to show only active or inactive
-
Minimum Age and Maximum Age: Choose a single age or a range
-
Earliest Data Collection Date and Latest Data Collection Date: Choose a specific time frame
-
Minimum Class Year and Maximum Class Year: Select a range or a specific class year
-
Only the Name and Metric or Assessment fields are required. All other fields are optional and simply refine how the data is displayed.
-
Click Save.

Your leaderboard will now appear in the table. From the ellipses menu, you can:
-
Edit the leaderboard
-
View the description
-
Delete the leaderboard
Displaying Leaderboards
Once a leaderboard is created, click the Display button in the top right.
Display Page Features
-
Leaderboard drop-down (top left)
Choose which leaderboard you want to show. -
Full-screen Zoom button (top right)
Expands the leaderboard to fill the screen. -
Settings button (top right)
Opens all display customization options.
Leaderboard Table Columns
-
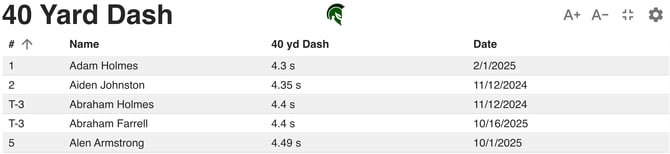
Number: Rank
-
Name: Athlete name
-
Metric or Assessment Value: The selected metric
-
Date: When the value was entered
Full-Screen View Settings
In full-screen mode, the top right includes:
-
A Plus and A Minus buttons (Zoom in and Zoom out)
-
Settings
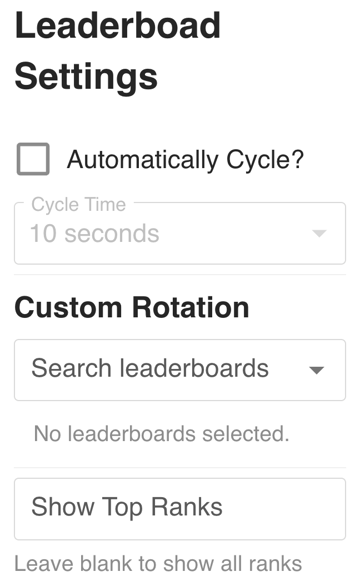
Settings Options
-
Automatically Cycle
-
Tick the box to enable automatic rotation
-
Set the Cycle Time, which determines how long each leaderboard stays on screen
-
-
Custom Rotation
-
Select specific leaderboards to rotate between
-
-
Show Top Ranks
-
Enter the number of athletes you want displayed
-
Example: Entering “10” will only show the top 10 ranked athletes
-
At the bottom right, a Next button allows you to manually cycle to the next leaderboard when multiple are selected for rotation.
Use Case Example
Leaderboards are commonly displayed on TVs in weight rooms, hallways, or locker rooms. They replace outdated bulletin boards and make performance results dynamic and engaging.
Examples:
-
Display the fastest 40-yard dash times of all time
-
Showcase the best vertical jumps recorded during a specific summer training block
-
Track class year progress by showing top results for a given grade
Leaderboards help create excitement and motivation while digitizing what used to be a written wall of names.